
The National Party has been caught getting their numbers wrong over the decline of real wages on their watch by the Green Party.
Last week, Green Party leader Dr Russell Norman pointed out that wages and salaries have risen by less than inflation during the term of the National government according to StatisticsNZ’s Labour Cost Index.
Economic Development Minister Steven Joyce accused Dr Norman of “making stuff up” and claimed that an alternative measure called the Quarterly Employment Survey (QES) is a better measure.
Statistics NZ however disagrees. They say “if you are interested in changes in earnings across time, the Labour Cost Index (LCI) is a better measure than the QES”. The QES measures the average wage paid. But averages can be pulled up by a few getting a big pay rise or by low paid workers becoming unemployed. It was true that in the late 1990s well-paid professions continued to do reasonably well while some (lawyers, accountants, doctors) did very well. So the average may have risen while the vast majority earned below the average.
Two-thirds of wage and salary earners actually earn below the NZ average wage of about $28.03 an hour.
Over the long term real wages fell by about a quarter in the late 1980s and early 1990s and have never recovered since.
The official statistics confirm that over the last three decades wages have failed to keep up with inflation – at least for the big majority of workers. Rather than wage increases pushing up prices, wages have unsuccessfully lagged behind price increases.
I did the following graph which showed a steady rise in real wages from 1957 to 1981. During nearly that whole period unemployment was only 1-3%. But the bosses organised a fight back that has pushed real wages back down to levels previously reached in the early 1970s.

This real wage index is based on a measure March Quarter 1978 = 1000.
Even if we use the QES figures favoured by Steven Joyce then the recovery in average real wages has been less than the previous decline.
The following graph covers the same period as mine but is from a couple of quite right wing economists who use the same data sources as mine for the period 1957-1992 but (naturally) prefer the QES rather than the LCI for the period since then.
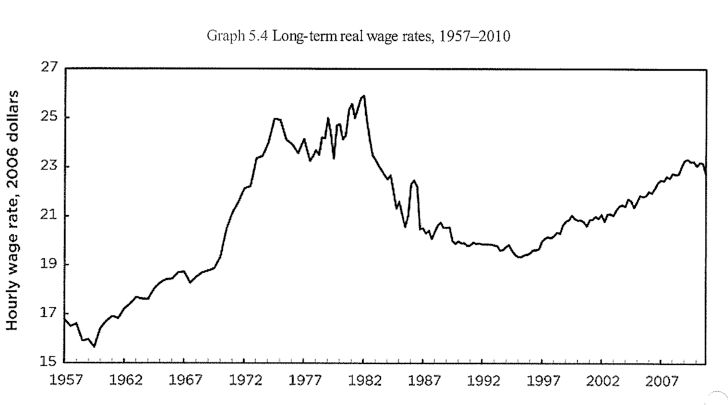
See Graph 5.4 in “The New Zealand Economy: An Introduction” by Ralph Lattimore and Shambubeel Eaqub
Even their graph has real wages are still behind the level reached in the early 1970s. Their graph also has a real wage measure on the left measured in 2006 dollars. Using their numbers, real wages peaked at about $26 an hour dropped to just above $19 then recovered to $23 in 2009 before starting to drop again.
What they are saying is that even in their rosier picture an entire generation has grown up without real wage recovering to the level reached by their parents.
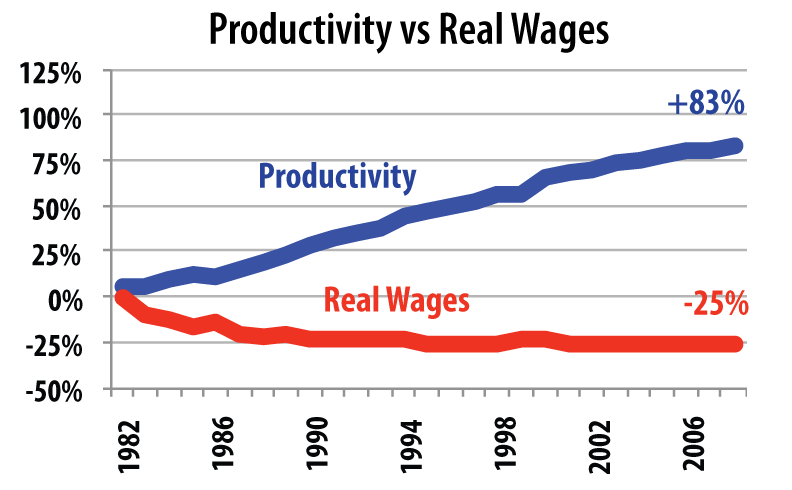
We were also told that if the cake was grown we would all benefit. Higher wages would come with increased productivity. We all heard the argument that a little pain now would mean riches for all to come.
Productivity did increase – by 80% between 1978 and 2008.
So real wages are 25% lower according to the LCI measure but our output is 80% higher. Any benefits stayed stubbornly at the top. The “trickle down” theory that if we make some very rich we will all eventually benefit proved to be a lie.
The shift in income from wages to profits is recorded in official statistics that measure the share of wages and profits in the economy. The period from the mid 80s to mid 90s saw a 10% drop in the share of GDP measured as “compensation of employees”. There was a corresponding rise in the proportion measured as “gross operating surplus”, that is profits and interest.
In today‟s dollars that equals $18 billion from the pockets of workers to the coffers of capital. That in turn has been shared among the very rich shareholders and senior executives and is the ultimate source of the gross increase in salaries other benefits of this layer in recent years
It’s time we got it back! But that means we have to be willing to stand up and fight.


Is someone able to confirm that overtime has been used to demonstrate how wages have risen?
“We were also told that if the cake was grown we would all benefit.”
This is presumably “Trickle-down” theory raising its ugly head again.
It has been pretty much totally discredited by economics experts world-wide. Yet the National Party continues to push it?? Whatever happened to POLITICAL INTEGRITY?
“Trickle-down” theory was a con right from the start. Wealth trickles UP, not down. As local jobs steadily become replaced by automation and robotics and off-shore out-sourcing, the money saved by laying off local workers goes straight to the top, while the newly unemployed are left to languish on poverty-line unemployment benefits.
Expect to see more and more of this as time goes on:
Just around the corner – Robotics to replace lowly-paid elderly care workers. Driverless cars to replace taxi drivers . . . . All of this is designed to push more and more profits in the direction of the already over-monied, under-taxed wealthy.
At the expense of the other 95% of society of course.
Well said, Murry.
An other problem is there’s not enough community minded people around who share their innovations with us all instead on trying to cash in. Jonas Salk’s polio vaccine and Tim Berners-Lee’s invention of the World Wide Web are twonotably exempts who should be esteemed.
All too often public funds are used to develop concepts which then handed over to private developers. A notable example being the U.S. government’s ( read U.S. taxpayer) development on the internet which was then used by Bill Gates, Google, etc. for them to cash in on.
Well written.
We need more stuff like this to counteract Nat’s bullshit propaganda!
Nicely done, Mike.
Now wait for the right wing trolls to come and blame it all on Labour or fucking sunspots or something equally ridiculous.
Yeah, nah, this is the clearest indication yet that National has made an EPIC FAIL.
Thank you, especially for one mapping productivity against wages. It always makes me laugh when right-wingers say that wage increases come from increased productivity – if that’s the case, NZ’s employers are in arrears to its workforce for hundreds of millions of dollars.
yeah the tune of 18 billion the big corporates owe the nz wage goer.
Just imaging if that money was floating round in our economy we really would be an economic rockstar in stead of a rock at the bottom of a rock pool.
Personally it looks like nothing really as altered over the past few years which is at odds with what many on the left have been claiming.
Fight! Hell yeah! Bring on the wharfies!
Oh. Too few, now, to notice?
Oh well.
Bring on the freezing workers!
Oh. Not many of them, either.
Oh well.
Cook Strait ferry workers!
Subdued, eh. Oh well…
Who’s left in large and influential numbers?
Middle managers at MSD?
Yeah, right.
OK, surviving union organisers. Which group is going to take the hit for all the hopefuls standing under the dry spigot waiting for Trickle Down?
The recent Auckland wharfies’ strike was certainly noticed enough by NZ business for them to get a pet National MP to draw up a private members bill legalising scabbing. They may indeed be fewer now but they are still in a critical place in the NZ economy and consequently still have immense potential power. Same goes for workers in the meat and dairy industry.
Maybe what we are seeing here is an adjustment of the productivity/wage ratio in some of the main sectors. I can remember in the mid 70’s to mid 80′ seeing the exact opposite of this happening as wage growth outpaced production at an alarming rate. They were dark days for us middle class small businesses, I can tell you.
The sad fact that we have to get used to is that in a lot of cases, we are competing with economies on the other side of what is now a very small world whose workers are accepting, for one reason or another, $70-90 a month to do a poor imitation of the same job.
Mike, that Productivity-Wages chart is interesting. It compares almost precisely with this graph, from the New York Times, on US wages/productivity; https://www.nytimes.com/imagepages/2011/09/04/opinion/04reich-graphic.html?ref=sunday
The divergence between wages/compensation and productivity seems to have begun at rough the same time – the rise of Thatcherism (UK) and Reaganomics (US).
Coincidence? Hell no. Not when the NZ situation mirrors that of Americans.
Great graphs, Frank.
I see one of the sources for them was Robert Reich, I have been following his articles on various U.S. websites for a couple of years and can’t wait to see the movie “Inequality for All”.
Trailer…
http://www.youtube.com/watch?v=9REdcxfie3M
Wealth Inequality in America….
http://www.youtube.com/watch?v=vttbhl_kDoo
Thanks, Yogi.
And thanks for those two links. Brilliant stuff. I’ll be looking out for more stuff to read, by Robert Reich.
I’ll see if I can find that doco on DVD, to watch.
I’ve seen the second link before. It’s something every person in the world should see. That would spell the end of neo-liberalism for good. It’s incredible that this economic scam has been allowed to persist for so long…
[…] Mike Treen pointed out real wages have declined by 25% since the mid1980s with that money transferred directly to […]
Comments are closed.