There are nine different measures for child poverty, and these statistics were published today for the year ended June 2019, Stats NZ said today.
“The nine measures reported today provide a broader picture of child poverty in New Zealand than a single measure could,” labour market and household statistics senior manager Sean Broughton said.
There were generally decreases in the low-income measures, though most of the changes likely reflect the expected uncertainties present in all sample surveys. There was no significant change to material hardship rates.
We produced the statistics from our improved household economic survey (HES), which surveyed adults in more than 20,000 households in 2018/19, compared with between 3,500 and 5,500 households in previous years.
The Child Poverty Reduction Act 2018 requires Stats NZ to report annually on a set of nine different measures. Three of the nine measures have targets to reduce child poverty over three- and 10-year periods.
The proportion of children living in low-income households are presented both before and after housing costs. The income measures use an equivalised median income, which means the income is adjusted for household size and composition.
Child poverty statistics: Technical appendix 2018/19 includes the different median incomes for different household compositions.
In the year ended June 2019, about one in seven New Zealand children (168,500) lived in households with less than 50 percent of the median equivalised disposable household income before housing costs are deducted.
After housing costs have been deducted, the number of children living in New Zealand in relative poverty rises to one in five children (235,400). This measure, accounting for both inflation and the impact of housing costs, shows about 20.8 percent of children live in households with an income below half the 2017/18 median equivalised disposable household income.
As well as looking at incomes before and after housing costs have been deducted, Stats NZ reports on material hardship, which indicates the number of households missing out on more than six of the 17 basic things most people would regard as essentials.
“Examples of material hardship include the respondent reporting not eating fresh fruit or vegetables, putting off a visit to the doctor, or not being able to pay the gas or electricity bills on time,” Mr Broughton said.
Looking at that material hardship measure, in the year ended June 2019, about one in eight children (13.4 percent) lived in households reporting material hardship. There was no significant change from 2017/18 to 2018/19 in material hardship rates.
Findings for Māori and Pacific peoples
The increase in the HES sample size has meant that, for the first time, we are able to produce child poverty statistics for different ethnic groups and for different regions in New Zealand. While we do not have the data available to produce comparable statistics for past years, we will continue to monitor trends going forward.
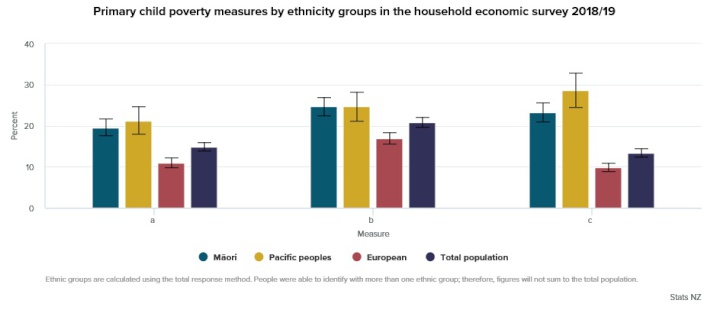
The results show that, while there are children from all ethnic groups living in households with relative low income and in relative material hardship, the rates for Māori and Pacific peoples are higher across most measures compared with the national average.
In the year ended June 2019, about one in five Māori children (55,000) lived in households with less than 50 percent of the median equivalised disposable household income before housing costs are deducted. The rate is similar for Pacific children (30,200). These rates compare with about one in nine for European children (80,300).
After housing costs have been deducted, the number of Māori children living in New Zealand in relative poverty rises to about one in four children (69,100). This measure, accounting for both inflation and the impact of housing costs, shows about 24.7 percent of children live in Māori households with an income below half the 2017/18 median disposable household income. The rate is the same for children in Pacific peoples’ households (35,000 or 24.7 percent). These rates compare with about 17.0 percent for children (124,300) in European households.
Looking at material hardship, in the year ended June 2019, almost one in four Māori children (23.3 percent) lived in households that are doing without six or more of the 17 material basic needs. The rate is higher for Pacific children at 28.6 percent. These rates compare with a rate of about 1 in 10 for European children (9.8 percent.)

Interpreting child poverty statistics
The figures were produced from the Household Economic Survey (with an increased sample of more than 20,000 households) and like all surveys, estimates are subject to some uncertainty because we have surveyed just part of the population, not everyone in New Zealand.
This range of uncertainty should be considered when looking at year on year changes. We encourage users to look at trends over several years. Small changes year on year are unlikely to be statistically significant because they fall within the range of expected uncertainty.
The Household Economic Survey is conducted over 12 months from July to June and collects annual income from people aged 15 and over for the 12 months prior to the interview. This means that the incomes of households interviewed in 2018 include some income from 2017, and only the very last households interviewed include income from the entire 2018/19 year. As such, it will take at least one more survey before these income-related policy changes will have close to their full effect on the reported annual income of all households interviewed.
“For example, if a member of a household had a wage rise or benefit increase just after they were surveyed in mid- 2018, that would not be recorded in our results, even though the children in that household may have benefitted from that rise in income for the subsequent 18 months,” Mr Broughton said.
The Families Package was gradually phased in from July 2018. Only those interviewed at the very end of the survey period will have annual incomes that fully reflect the 1 July 2018 changes in the Families Package.
The table below shows how the rates have changed since 2017/18.
For further information about poverty-related government policies, visit:
• Formal gazetting of targets for reducing child poverty
• Families Package from Work and Income
• The Families Package from The Treasury.
The Government Statistician authorises all statistics and data we publish.
For more information about these statistics:
• Visit Child poverty statistics: Year ended June 2019


