
In the June 2018 quarter, 22.3 percent of disabled people were working, Stats NZ said today. This compares with 70.0 percent of non-disabled people.
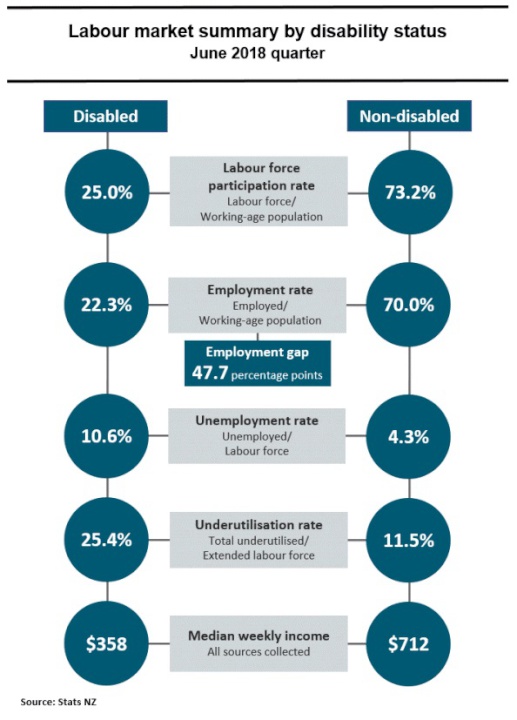
Text alternative for labour market summary by disability status: June 2018 quarter
“The difference between the employment rates of disabled and non-disabled people is the disability employment gap,” labour market manager Sean Broughton said. “It’s a key measure of how disabled people are faring in the workforce. In 2018, the disability employment gap was 47.7 percentage points.”
While employment rates for disabled men (23.5 percent) and women (21.3 percent) were similar, the disability employment gap for women (43.6 percentage points) was smaller than that for men (51.8 percentage points). For people under 65 years, the gap was 39.5 percentage points.
Median weekly income (from all sources collected) for disabled people was $358, about half that of non-disabled people. Disabled people were more likely to receive some or all of their income from government transfers, such as Jobseeker Support, New Zealand Superannuation, and the Disability Allowance. Disabled people were also less likely than non-disabled people to earn income from wages and salaries, and self-employment.
On average, employed disabled people worked fewer hours per week than employed non-disabled people, and were more likely to work part time. Disabled people were also more than twice as likely as non-disabled people to be unemployed or underutilised.
“This is the second year Stats NZ has included questions about activity limitations in the household labour force survey,” Mr Broughton said. “These questions allow us to present a broad picture of labour market outcomes for the disabled community.”
Disabled people are identified as those who have at least a lot of difficulty in one or more of six specified activities. These activities are: seeing (even with glasses), hearing (even with hearing aids), walking or climbing stairs, remembering or concentrating, self-care, and communicating.
Video
View our Labour market statistics (disability): June 2018 quarter video.
Ends
For media enquiries contact: Sean Broughton, Wellington, 04 931 4755, info@stats.govt.nz
The Government Statistician authorises all statistics and data we publish.
Text alternative for labour market summary by disability status: June 2018 quarter
Labour force participation rate is labour force divided by working-age population: 25.0% disabled and 73.2% non-disabled.
Employment rate is employed divided by working-age population: 22.3% disabled and 70% non-disabled. Diagram highlights the employment gap between disabled and non-disabled: 47.7 percentage points.
Unemployment rate is unemployed divided by labour force: 10.6% disabled and 4.3% non-disabled.
Underutilisation rate is total underutilised divided by extended labour force: 25.4% disabled and 11.5% non-disabled.
Median weekly income for all sources collected: $358 disabled and $712 non-disabled.
For more information about these statistics:
• Visit Labour market statistics (disability): June 2018 quarter


The harsh reality is a lot of people with certain disabilities are not able to consistently hold down paid employment, no matter how much they want to, even if there were full employment with jobs going spare.
But for those who can, the reason for the statistics is pretty simple- employer discrimination. Not legal, but alive and kicking, even in the Public Sector. All the qualifications and experience means nothing and it’s impossible to prove said discrimination unless they put it in writing.
Comments are closed.