
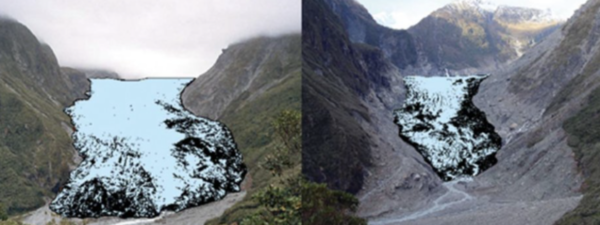
Fox Glacier 2009-2019
Māori Climate Commissioner, Donna Awatere Huata, has said the latest research from the U.S. journal Proceedings of the National Academy of Sciences (PNAS) shows we need urgent climate action now.
” The East Antarctic ice sheet is now melting adding to the increased losses we are seeing on the Western side. Between 1979-90 we were seeing an average net ice loss of 40 billion tonnes per year, that has rapidly accelerated to 252 billion per year on average between 2009-17.”
“The climate crisis is here and it is now. Antarctica is a crucial link in that chain of events. As we see record heat waves striking Australia, recent wild fires in California and New Zealands hottest year on record, we must force our political system to push our economy, culture and communities into adaptation resilience.”
“Our political system, like those of most of the rest of the signatories to the Paris agreement has the reaction time of the Titanic – .”
Donna Awatere Huata
Māori Climate Commissioner
There’s some stuff I would like the scientists and mathematicians on this blog to check for me on climate change.
It seems that over the last 100 years or so, specially the last 50, the CO2 content has risen by one percentage point of the atmosphere. Roughly from 3% to 4% of the air. As the total atmospheric CO2 is calculated at about 2×10 to the power of 12 , i.e. 30 trillion tons . an increase from 3% to 4% of that represents a 25% increase of CO2 in the last 100 years . That is a quarter of 30 trillion tons added in 100 years. … 7.5 trillion tons. That averages 75 billion tons per year, and must be far more than that during the last 50.
But they calculate that all coal and oil emissions are producing about 30 billion tons a year, and burning forests about 1.5 billion. So Co2 seems to be increasing at 2.5 times the rate that we are producing it. Or if you assume that production was nowhere near the present level 100 years ago, and 30billion produced now is far more than the average has been, then the CO2 content is increasing at far more than two and a half times what we are putting in. Not that what we are adding is not alarming.
But if my assessment of these statistics stands up to other’s research and reasoning, then it would suggest that something else is going on either in parallel or as a massive positive feedback to CO2 increase. In the past temperature seems to controlled the CO2 level in the air rather than the other way round as temp. increase or decrease has preceded CO2 atmospheric increase or decrease. Is that what is really happening now? And is there absolutely nothing we can do about it? That is a much more alarming thought because where will it end if it is not caused by our emissions and deforestation?
Can someone check my figures please? Better to do you own googling.
D J S
DJS. ‘Better to do you own googling’
You state: ‘over the last 100 years or so, specially the last 50, the CO2 content has risen by one percentage point of the atmosphere. Roughly from 3% to 4% of the air.’
Well, it would take you about one minute to access a scientific website and read that ‘ By volume, dry air contains 78.09% nitrogen, 20.95% oxygen,[2] 0.93% argon, 0.04% carbon dioxide, and small amounts of other gases.’
So your 4% figure for CO2 is 100 times too large.
It would take you about one minute to access the 800,000-year atmospheric CO2 record and recognise that the long-term average was around 230ppm, and that the most recent natural peak established approximately 280 ppm as the baseline from which industrialism has increased the level to around 410ppm. It does not take a lot of effort to discover that atmospheric CO2 has recently been increasing at between 2 ppm and 3 ppm per annum (versus less than 1 ppm per annum rise when Keeling began measurement in the late 1950s.)
December CO2
December 2018: 409.23 ppm
December 2017: 406.75 ppm
Examining the atmospheric CO2 records
https://scripps.ucsd.edu/programs/keelingcurve/wp-content/plugins/sio-bluemoon/graphs/co2_800k.png
https://scripps.ucsd.edu/programs/keelingcurve/wp-content/plugins/sio-bluemoon/graphs/co2_800k_zoom.png
reveals that atmospheric CO2 is now approximately 180 ppm above the 800,000-year average and is around 130 ppm above the eighteenth century pre-industrial level.
It does not take a lot of time to find out that CO2 released into the atmosphere through the burning of fossil fuels has been absorbed by the oceans and has been bound via chemical combination in the oceans or weathering of terrestrial rocks. The build-up in the atmosphere is a measure of that which has not been absorbed or chemically bound via weathering.
It is better to not include photosynthesis because in the absence of industrial emissions the global photosynthesis system was in balance for long periods of time. It is the excess CO2 over and above that generated and absorbed naturally that is the cause of our predicament. (In practice, however, humans have significantly altered the photosynthetic systems via cutting down forests and jungles and replacing them with agricultural systems.)
The rise in atmospheric CO2, particularly that over the past 60 years, is clear evidence that industrially generated CO2 has been increasingly overwhelming natural systems that recycle it (and prior to industrialism kept atmospheric CO2 in the range 180 ppm to 280 ppm for hundreds of thousands of years).
‘Last year, humanity dumped an all-time record — exceeding 36 billion tonnes of CO2 (GtCO2) for the first time ever. This year we are on track to exceed 37 GtCO2.’
https://www.nationalobserver.com/2018/12/12/analysis/co2-vs-cops?fbclid=IwAR0M_fetxmGObvgSXuz7wtzpuy6L0ZteZo7svGjQlqlS_RYQ6aoWnyYh0vM
https://www.youtube.com/watch?time_continue=5&v=lNZOtrAzJzg
What does the U.N. know??
The most important guy in the room doesn’t know about 5G but knows how much ice is melting? Hmm.
Honestly, I’d rather like a good 3G network on the rail network (the network there is crappy at anytime outside midnight or so) than a 5G network on the surface. Being able to read stupid comments on TDB on my way home is more IMHO interesting than watching videos of side rape and TYT in the street.
Lol coldest ever recorded temp in Antarctica this year, most Ice in the last 3 decades at the Arctic, Europe, USA, Canada and Russia having massive freezes and record snow falls, ppl in the Sahara freezing to death in Snowstorms, global food production down 30 percent, but you still push the bankrupt and debunked man made climate change bullshit.
Are you hoping for a U.N. job?
Do you read from the App Store? I only ask because in your universe the equator is totally disconnected from your perceived version of reality.
Rick the increases precipitation is a result of warmer temperatures, evaporation of not only sea water but more vitally the increased use of ground water for irrigation globally.
Massive amounts of “fossil” water has been systematically extracted from large land areas, and water has been harvested from runoff and rivers, then used for irrigation with subsequent evaporation, so never reaches the sea as a part of long established river systems.
The increased precipitation falling as snow on the Antarctica as well as other areas plus the increased rain in warmer climes is all a part of a man made shift in climatic conditions. The sea level will rise with melt.
The ocean is warmer than even 50 years ago and more acidic.
Cherry picking bits of info hardly devalues the established core data on warming collected over a long time span.
Relying on snippets of information is a bankrupt path to understanding human damage to the planet.
There are too many humans consuming the Non Renewable Natural Resources, creating pollution, disrupting the balance of necessary wilderness and natural forest, destroying habitat of species vital to a healthy biosphere: all of which are shown in the many reports by scientific institutions over decades.
Still some live in denial grasping at straws, perhaps frightened to look at reality.
Have courage.
Comments are closed.