Child poverty stats can be tricky; We’ve put this information together in the hope it helps assist interpretation.
It’s too early to see how child poverty changed this term of government, on Stats NZ measures. More timely (but proxy) poverty indicators include employment, welfare, health, housing & foodbank stats.
There are two main reasons it’s too early to see if/how child poverty changed in this government term: data time period & sample error. All Stats NZ child poverty measures reflect change slowly as each is informed by two years of data, while analysis takes several months.
So the latest 2019 child poverty figures, released in Feb 2020, actually reflect data mid-2017 to mid-2019. That means, for example, effects of the Coalition Government’s Families Package are only partially included in the most recent data, because it didn’t come in until mid-2018.
This is because data come from the Household Economic Survey, & HES is conducted over 12 months, & every respondent is asked about their income -over the 12 previous months-. (Btw, latest figures released reflect responses from 20,000 households, rather than 3500-5500 previously)
Sample error: To see how likely the reported annual change is, we have to compare it to its “sample error” (like “margin of error”). (Righthand columns in the table at end of this Stats NZ release) https://stats.govt.nz/news/
If an “annual change” is a smaller change than “sample error on change”, then it is “not statistically significant”. For these figures, that means we cannot be 95% sure that the change really happened as reported. If an “annual change” is a smaller change than “sample error on change”, then the smaller it is, the less certain we can be that it actually happened. (Thanks to StatsNZ for their clear & comprehensive explanations; any errors are our own.)
In the latest release, only 2 of the 9 child poverty measures (“a” & “e”) reported by StatsNZ had annual changes bigger or the same as the “sample error on change”. Material hardship, for example, remained similar to what it was previously (that’s all we know).
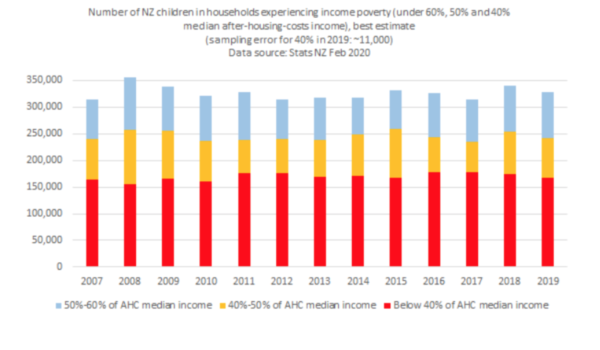
The graph at the end of this webpage (and attached) shows child poverty “moving line” relative poverty over 13 years (StatsNZ measures f, g & h). The lines waver sometimes, but the flat trend over time is partially why CPAG maintains we need to see a -significant- reduction of child poverty across after-housing-costs & hardship figures, sustained over several years before we can say government policies have helped lift the burden of poverty from our children & tamariki and their whānau.