
.
![]()
.
Continued from: 2014 – Ongoing jobless tally
So by the numbers, for this year;
.
Events
.
January
- Otago University: 20 redundancies
- Cavalier Carpets: 22 redundancies (plus management)
- Norman Ellison Carpets: 20 redundancies
February
- NZ Post: 400 redundancies
- SRX Global: 28 redundancies
- Mana Transport: unknown number of redundancies
- Fishing Camping Outdoors: unknown number of redundancies
March
- Harvestpro: 200 redundancies
- Smith and Davis: 120 redundancies
April
- Sanford: 232 redundancies
May
- Forman Building Systems: 22 redundancies
- Solid Energy: 113 redundancies & 15 sub-contractors
- Dunedin City Council: 15 redundancies
- Southern District Healthboard: 25 redundancies
- Corrections Dept: 260 redundancies
- Relationship Services: 183 redundancies
- Waihi Mine: 50 redundancies
- Fairfax media: 185 redundancies (160 new positions? net loss: 25)
June
- Foodstuffs: 128 redundancies
- Pagemasters: unknown number of redundancies
- Landcare: 11 redundancies
July
- New Plymouth City Council: 52 redundancies
- Fonterra: 523 redundancies
August
- DB Breweries: 24 redundancies (not yet confirmed)
- Unitec: 124 – 300 redundancies
.
Statistics
.
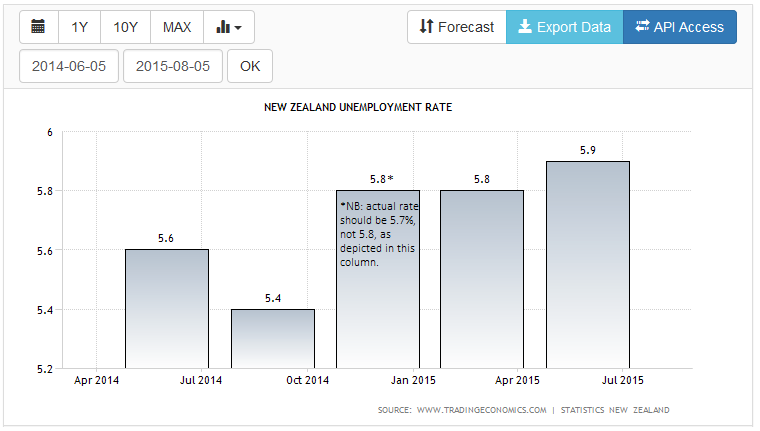
*NB: actual rate for Dec 2014/Jan 2015 Quarter should be 5.7%, not 5.8% as depicted in above column. See Stats NZ data here.
.
.
.
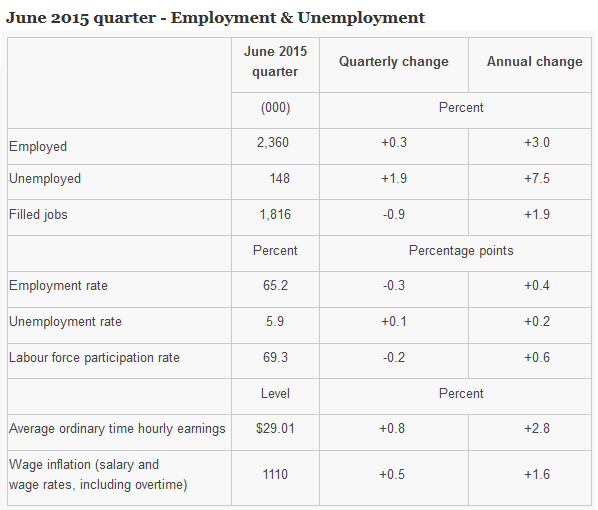
The unemployment rate increased to 5.9 percent in the June 2015 quarter (up from 5.8 percent), Statistics New Zealand said today. At the same time, there were 7,000 more people employed over the quarter (up 0.3 percent).
“Even though employment grew over the quarter, population growth was greater, which resulted in a lower overall employment rate for New Zealand,” labour market and household statistics manager Diane Ramsay said.
“Despite lower quarterly growth, this is still the 11th consecutive quarter of employment growth, making it the second-longest period of growth since the period between 1992 and 1996,” Ms Ramsay said.
Over the year to June 2015, employment growth was still fairly strong (at 3 percent) with 69,000 more people employed. The manufacturing industry showed the strongest annual employment growth.
“This is the first time since the December 2013 quarter that the construction industry has not been the largest contributor to annual growth in employment,” Ms Ramsay said.
The vast majority of growth was in Auckland (29,600 people), where the annual employment growth was driven by retail trade and accommodation, followed by construction. Bay of Plenty had the second-highest employment growth, with 11,000 more people being employed over the year.
Annual wage inflation, as measured by the labour cost index, was 1.6 percent, compared with annual consumer price inflation of 0.3 percent.
From ANZ Business Outlook survey:
A net 15% of businesses are pessimistic about the general economy; a six year low. General business sentiment is negative across all the five sub-sectors. Agriculture is the most pessimistic; services the least.
[…]
A downturn in construction sector sentiment is notable this month.
[…]
Construction is now the most negative sector by this measure
From WestPac Weekly Commentary:
In contrast, our views are predicated on the economy entering a sharp slowdown in the near term. Until this week our view was based only on a sense that the most recent declines in dairy export prices were an important turning point, and would seriously knock confidence across the economy. We have also been cognisant of the fact that the Canterbury rebuild has peaked nine months earlier than previously thought, and will no longer underwrite accelerating GDP growth. Updating our economic forecasts is a work in progress, but indicatively, we are looking at GDP growth dropping below 2% and the unemployment rate rising to around 6.4% by early next year.
From Fonterra:
Revised 2014/15 ForecastFonterra Co-operative Group Limited has today reduced its forecast Farmgate Milk Price for the 2014/15 season to $4.40 per kgMS. Along with its previously announced forecast dividend range of 20-30 cents per share, the change amounts to a forecast Cash Payout of $4.60 – $4.70 that would be paid to a fully shared-up farmer.
Building Consents – From Statistics New Zealand:
The seasonally adjusted number of new dwellings consented fell 4.1% in June 2015, though the trend shows steady growth between May 2011 (post Christchurch earthquake) and June 2014.
The actual value of building work consented in June 2015 was $1.3 billion – a drop from $1.4 billion in May 2015.
Residential: residential work was down from $868 million in May 2015, to $832 million in June 2015.
Non-residential: non-residential work was down from $486 million in May 2015, to $454 million in June 2015.
Source (May 2014)
Source (June 2014)
.
Addendum1: Under-employment
The under-employment stats;
People who are underemployed are those who work part-time, would prefer to work more hours, and are available to do so. In unadjusted terms, the number of underemployed grew by 12 percent over the year. While the number of part-time workers increased over the year, the ratio of people underemployed to employed part-time also rose – from 17.1 percent in June 2013 to 18.7 percent this quarter.
Official under-employment: up
Definitions
Jobless: people who are either officially unemployed, available but not seeking work, or actively seeking but not available for work. The ‘available but not seeking work’ category is made up of the ‘seeking through newspaper only’, ‘discouraged’, and ‘other’ categories.
Under-employment: employed people who work part time (ie usually work less than 30 hours in all jobs) and are willing and available to work more hours than they usually do.
Employed: people in the working-age population who, during the reference week, did one of the following:
-
worked for one hour or more for pay or profit in the context of an employee/employer relationship or self-employment
-
worked without pay for one hour or more in work which contributed directly to the operation of a farm, business, or professional practice owned or operated by a relative
-
had a job but were not at work due to: own illness or injury, personal or family responsibilities, bad weather or mechanical breakdown, direct involvement in an industrial dispute, or leave or holiday.
Addendum2: Other Sources
Statistics NZ: Household Labour Force Survey
.
.
[To be periodically up-dated]
.
.
= fs =


Corrections Dept: 260 redundancies
What???
Now all applying for 85 available positions with Serco.
They closed three prisons and opened one new one managed by Serco.
Unemployment has risen 41% since National took office.
From 105,000 to 148,000.
Just a reminder about the global recession that hit NZ in 2008. NZ’s unemployment rate peaked at 6.9% in 2012 and is well below that today. Indeed our unemployment rate today is lower than at any time between 1988 and 2000, when unemployment was falling.
As I said
Unemployment has risen 41% since National took office.
From 105,000 to 148,000.
Actually that is the official rate but what about the people who were taken off the dole for not reapplying isn’t that another couple of thousand? And then you have the people who are “employed” but only working very part time or casual hours.
Where’s Martyn’s the National Party Jeep flying through the air as the wheels fall off?
It’s all down hill from here right Frank.
What’s next for the NatZ to flog off?
Hospitals, Government Buildings and ACC as their failed cost cutting venture failed to leave us all in misery, and bankrupt?
This is what will happen to our remaining SOE’s if/when the TPPA is signed.
http://www.scoop.co.nz/stories/PO1507/S00296/tppa-leak-reveals-sweeping-restrictions-agreed-on-soes.htm
Total loss of sovereignty.
Cheers.
And some good news.
http://www.scoop.co.nz/stories/PO1508/S00051/legal-challenge-to-tppa-secrecy-lodged-today.htm
Cheers.
For some perspective,other unemployment rates:
EU 9.6% (http://ec.europa.eu/eurostat/statistics-explained/index.php/Unemployment_statistics)
US 5.3% (http://www.tradingeconomics.com/united-states/unemployment-rate)
Australia 6% (http://www.tradingeconomics.com/australia/unemployment-rate)
UK 5.6% (http://www.tradingeconomics.com/united-kingdom/unemployment-rate).
Further note: Despite the list of redundancies in 2015, the overall unemployment rate has barely moved during the period (5.8- 5.9%), which points to equally signifiant job creation.
Yes, thanks for that, it’s quite obvious that neoliberalism is destroying lives and economies everywhere it is embraced.
Mmmm, well the socialist experiment ended well didn’t it? Even China embracing capitalism…wonderful isn’t it!
You mean the Chinese government propping up the share market so it doesn’t collapse?
The Chinse government SOEs involved in business?
Cheap finance available from Chinese State banks?
If that’s “capitalism”, it’s a very strange, mutated form of it.
As for failed socialist experiments – your posting here was done on copper lines, built up by the previous Post Office – a State owned organisation using taxes to build up this country’s communication infrastructure.
Capitalism had nothing to do with it.
It’s also noteworthy that governments around the world spent billions of dollars, pounds, euros, etc, to bail out corporations that were teetering on the brink of collapse in 2008. Even the former President Bush spent over US$700 billion to bail out American companies (http://www.huffingtonpost.com/2008/09/20/bush-asking-for-700-billi_n_127926.html). So much for your precious capitalism.
But you just keep indulging in your fantasies, LK. It offers an opportunity for us to present the facts.
Mmmm, well the capitalist experiment ended well didn’t it? Even China embracing post capitalism…wonderful isn’t it!
Side note. I hit like on the original post by mistake and can’t change it to dislike. Should read 6 thumbs down instead of 4
“the overall unemployment rate has barely moved during the period (5.8- 5.9%)”
Flogging a dead horse?
It would be equally useful to look at the number of small enterprises that have ended over the same period.
The ever-declining standards of management.
The pitiful ‘me-too and wannabe’ enterprises.
The sorry dearth of innovation, or even improvement.
The closed shops and mates’ rates environment that is encouraging ridiculous and excluding pricing eg building, power, broadband.
Neo-liberalism is anathema to ingenuity, innovation, invention, enterprise. It’s for cowards and safety-seekers. Fear-mongers and those who are short on fresh ideas. Dead.
Labour killed the creativity and diversity of the public service. National featherbedded the already-established and changed the enterprise ecology to ‘unfriendly’ for start-ups.
Set this old game aside for those who love it so much – and let the rest of us get on with prospering in the changes we’re living with.
Hmmm, you’re totally ignoring the data, aren’t you, LK? Unemployment is increasing, and you’re spinning it that it’s “barely moved”?
It’s gone up by half a percentage point since last October.
In June 2014, the HLFS reported 137,000 (5.6%) unemployed (http://www.stats.govt.nz/browse_for_stats/income-and-work/employment_and_unemployment/HouseholdLabourForceSurvey_HOTPJun14qtr.aspx)
In June 2015 – a year later – that figure has jumped to 148,000 (5.9%) unemployment. (http://www.stats.govt.nz/browse_for_stats/income-and-work/employment_and_unemployment/LabourMarketStatistics_HOTPJun15qtr.aspx)
“Barely moved”? It’s moving in the wrong direction.
It should be moving down. Not up. Clear enough?
Come on guys ….. 21 Goals of the Bilderberg. Plans are going nicely! National Debt: $101,697,492,551 climbing.
Project New American Century slightly behind but speeding up to be on the reset target ….. just need to get hands on the land as farmers walk off.
But I have good news ….. 😀 Time’s nearly up.
BRICS and AIIB doing awfully well cementing control and changing world currency reserve. Once established, more good changes quickly on the way.
Goodbye bad guys. Hello, new jobs.
1000% Helena.
Just remember lionking that the gfc was caused by the parasitic gambling class that ran the financial institutions ……….. these people ( and john key was one of them ), sucked out huge amounts of wealth while producing nothing.
John key showed just how useless he actually is when the effects of the GFC were hitting hard and his great idea to help fight unemployment was ” lets build a cycle way ” .
Apart from that brain fart from Key, nationals other great economic plan was to turn NZ into a giant dairy farm overflowing with cow shit into all our rivers and waterways.
As a money trader key got rich working in a rigged market
As a prime minister he’s been shit at everything apart from selling our country out.
Dairy prices have now collapsed and is taking the value of our dollar with it.
Key and nationals reckless economic incompetence is coming home to roost ……….
God defend new Zealand
I don’t share your pessimism, R. We don’t get everything right in this country, but by international standards our economy is in pretty good shape.
Well, that’s reassuring, LK. I’m sure the 148,000 unemployed will sleep well tonight.
By the way, that comment of yours totally ignores the references I posted from ANZ, Fonterra, Statistics NZ, and Westpac. But that’s ok, ‘cos your opinion that “by international standards our economy is in pretty good shape” trumps all those experts and their analysis.
Nice spin. Pity it’s bullshit.
Here’s a good explanation of the wealth distribution in U.S., which applies here very well:
http://www.washingtonpost.com/…/this-viral-video-is-right-we-need-to-worry-ab
But it’s all going to change starting with a major economic event beginning in September. Collapse of the international banking system (the wealthy hoarders are bankrupt 😀 ) and the roll out of the RV GCR NESARA.
Great news!!! Time to swot up on NESARA.
Is it that New Zealanders, Nat voters especially can not comprehend that there redneck ideas are retrospective fixes. For example. Dairy prices fall then the redneck fix would be sell to foreigner.
Put it another way. When house prices rise faster than wages. Rednecks think it’s because of their own genius. Not recognising the only reason house prices rise is because some one is willing to borrow more than the redneck did. Or sell to Australian oligarchs.
Ongoing jobless tally «Frank Macskasy – The Daily Blog. Screen Shot 2015-05-21 at 6.
Comments are closed.