
.

.
Looking through the on-line Budget document on Treasury’s website, I happened to notice something… peculiar.
The following page is entitled Responsibly managing the Government’s finances and is part of Finance Minister Bill English’s summary. As such, it is a political document and not a Treasury report.
.

.
Note the five graphs on this page. Notice anything about them?
Any… inconsistencies?
Let me “lump” them together, so they can be better compared;
.

.
Note the starting dates on each graph. They differ in nearly each case;
- 2012/13
- 2006/07
- 2009/2010
- 2004
- 2004
At first glance, there appears no reason for the difference start-dates of each graph.
That is, until you look at what each graph represents.
Graphs number 2, 4, and five show the previous Labour government in an unfavourable fiscal light.
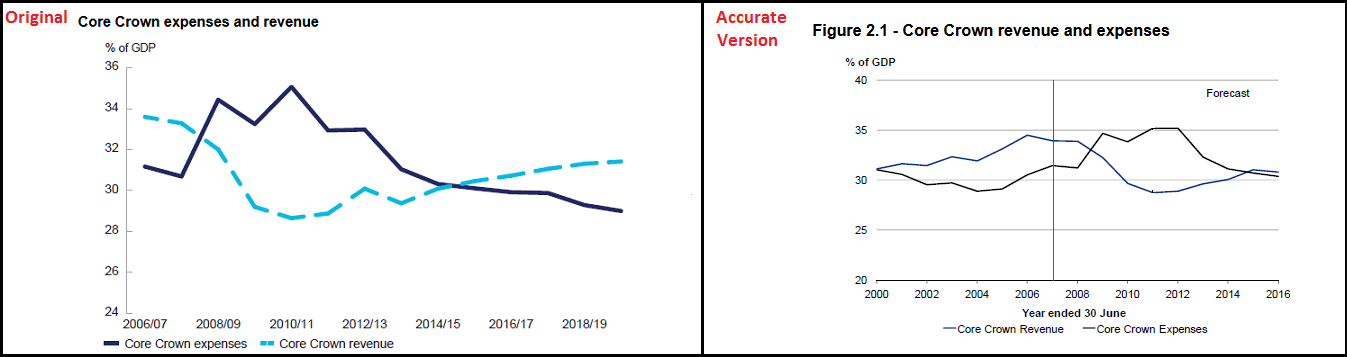
#2: Shows “Core Crown Revenue” falling from 2006, and “Core Crown Expenses” rising from around the same time.
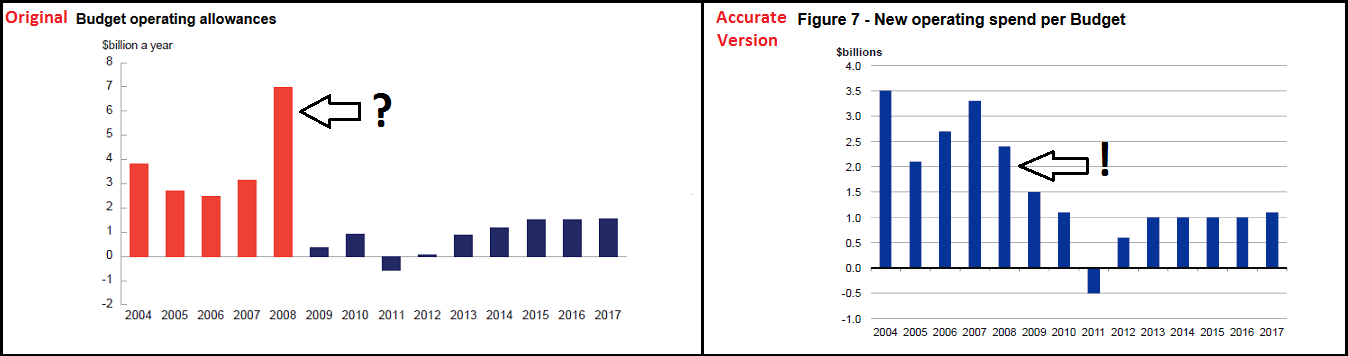
#4: Shows “Budget Operating Allowances” much higher under Labour – highlighted by the use of red and blue column lines – than National. The 2008 red-bar is erroneous.
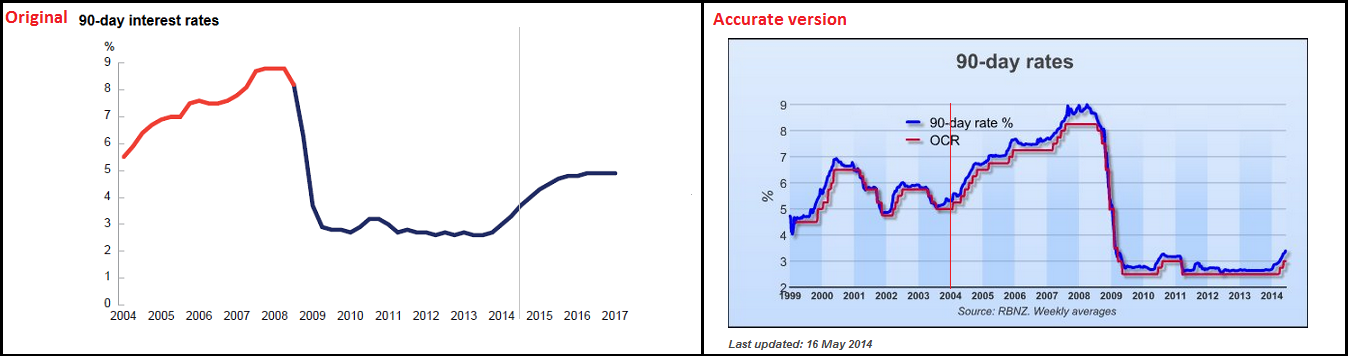
#5: Shows “90 Day Interest Rates” higher under Labour than National – again highlighted by the use of red and blue graph lines.
Meanwhile, graphs 1 and 3 show National in a more positive position;
#1: Shows “Total Crown operating balance before gains and losses (OBEGAL)” starting from 2012/13, and reducing. There is no prior context depicted for any previous years. The overall impression is a favourable one to the viewer.
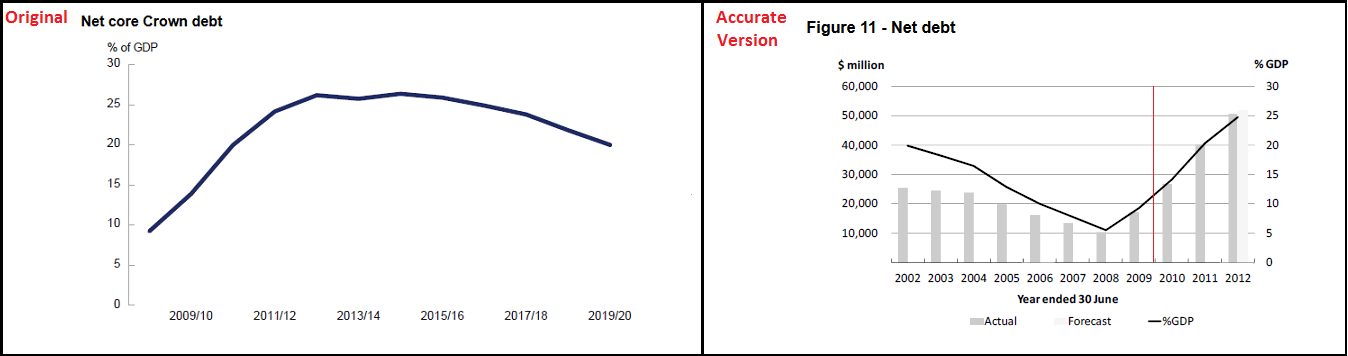
#3: Shows “Net Core Crown Debt” rising from 2009; peaking at 2013/14; and dropping thereafter. Again, there is no prior context depicted for any previous years.
If we replace the mis-leading charts with more accurate representations, the picture is unsurprisingly different. A verticle red line on the right hand, accurate graph, pinpoints where Bill English’s graph (on the left) starts.
1. Total Crown operating balance before gains and losses (OBEGAL)
.

.
The more accurate version on the right gives a more complete picture of successive government’s Total Crown operating balance before gains and losses (OBEGAL), and put’s National’s record in context.
2. Core Crown revenue and expenses
.
.
The more accurate version on the right gives a more complete picture of successive government’s Core Crown revenue and expenses, and put’s National’s record in context.
This next one is a personal favourite of mine, and National/ACT supporters hate it with a passion.
3. Net core Crown debt
.
.
The more accurate version on the right gives a more complete picture of successive government’s Net core crown debt, and put’s National’s record in context. It also happens to highlight Labour’s track record in reducing the country’s sovereign debt – something that jars with Right Wing historical revisionism that attempts to depict Labour as an incompetent fiscal manager.
4. Budget operating allowances
.
.
Whilst English’s graph (on the left) has a start point in 2004, it is highly inaccurate. Note the red bar for 2008, showing Labour having a Budget operating allowance of around $7 billion. This is false. As the blue bar on the graph on the right shows, the Budget operating allowance for 2008 was just under $2.5 billion – one third of what English’s chart depicts.
Note: the chart on the right, with the blue bars is taken from Budget 2013 – Bill English’s own document from last year. The correct data (blue graph) is supported by a 2010 Treasury working-paper, Fiscal Institutions in New Zealand and the Question of a Spending Cap.
Either the red bar for 2008 is an error – or a deliberate attempt to further portray the previous Labour government in a bad light. Considering that three out five graphs appear to have been selectively presented, the possibility that the 2008 red-bar was deliberately fudged cannot be excluded.
5. 90-day interest rates
.
.
English writes that “Future Budget allowances are set at sustainable levels… [graph inserted] ...which is helping to take pressure off interest rates“.
Actually, the reason that the OCR and 90 Day Rates are currently at a historic low has little to do with “future budget allowances“. The Reserve Bank does not set current OCR/90 Day Bill Rates against “future” budget allowances.
Indeed, the RBNZ dropped the OCR to 2.5% in April 2009, the following year from recession hitting our economy.
There is next to no reason for English to have included the 90 Day Interest Rate in his Budget document, except to attempt to take credit for historically low interest rates that were the result of a global financial crisis and not because of any actions his government took in 2007/08.
Not unless he, John Key, and the rest of the National caucus were sitting in Board Rooms across Wall Street?
Not unless he, John Key, and the rest of the National Party were in government a full year before the 2008 general election?
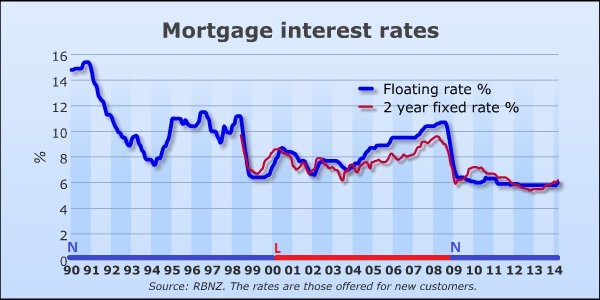
And not unless Bill English also wants to also claim responsibility for high interest rates in the 1990s, when the National Party governed under the leadership of Jim Bolger, with finance ministers Ruth Richardson and Bill Birch? When interest rates peaked at over 15% in 1990 and were consistently high throughout the 1990s.
Unsurprisingly, this is one graph that did not find it’s way into Bill English’s 2014 Budget document;
.
.
As for Budget 2014 – I suspect it is a document that will soon reveal more hidden surprises for us all.
.
References
NZ Treasury: Budget 2014 – 1. Responsibly managing the Government’s finances
NZ Treasury: Operating Balance (2002-2011)
NZ Treasury: Core Crown revenue and expenses (2000-2014)
NZ Treasury: Net core Crown debt (2002-2012)
NZ Treasury: Operating Allowances
NZ Treasury: Fiscal Institutions in New Zealand and the Question of a Spending Cap
Reserve Bank NZ: 90-day rate
Reserve Bank NZ: Mortgage interest rates — since 1990
.
Above image acknowledgment: Francis Owen/Lurch Left Memes
.
.
= fs =


Superb presentation Frank. Another example of how National is fudging the books, which itself is just an euphanism for false accounting. If a private firm did this it would and should be prosecuted. National has been getting away with this crap for far too long with the assistance of the MSM who avoid these issues for fear of upsetting the John Key band wagon and losing those glorious photo ops.
If National is getting away with it then perhaps you should direct your attention to the opposition parties then. I don’t think I saw any major complaints from either the Greens or Labour around the substance of the budget. Certainly nothing was stated that they have cooked the books as you imply.
*sigh*
And as usual, Gosman, you’ve deflected from the main points raised here…
The big conclusion one has after reading this article is “so what”.
Much ado about nothing, Frank.
Quite wrong Mark. In fact, this is one example of how National is trying to get New Zealanders to believe that a Labour-led Government could not successfully manage the economy, only six years after they were successfully doing so. It’s called brainwashing.
Labour left low debt but 10 years of predicted deficits. National has brought the budget back in to the black in a little over half the time. while managing both the effects of a global downturn and a major earthquake damaging our second biggest city. That is why they are regarded as good economic managers.
Only in your dreams they are good money managers all they give a f….. About is their monied mates the rest of us are just dirt.
Hmmm, I see you’ve abandoned your “decade of structural deficits” bullshit, Gosman?
But you’re still telling bullshit. No one has referred to “Labour left low debt but 10 years of predicted deficits” except right wing bullshit artists, such as Key.
Because you can’t deal with Labour,
* paying down NZ’s sovereign debt to near zero,
* Cullen posting nine consecutive surpluses,
* unemployment at historical lows,
* plus a tax cut in 2008 (which I do not agree wise necessarily wise)
But you keep spinning your National-inspired rubbish, Gosmann.
It just makes you look silly.
I haven’t abandoned anything Frank. My position is exactly the same as it has ways been on this issue. Labour left a structural deficit predicted to last ten years. National has reduced this time via reasonably prudent fiscal policies. That is the reason people regard National as better economic managers than Labour.
You have no evidence for that. It’s an opinion based on nothing except bits and pieces you’ve picked up and your heavily ACT-inspired views.
Are you really up to be made to look foolish (again)?
And as I remind you (again);
Labour succeeded in;
* paying down NZ’s sovereign debt to near zero,
* Cullen posting nine consecutive surpluses,
* unemployment at historical lows,
* plus a tax cut in 2008 (which I did not support)
“Cullen posting nine consecutive surpluses,”
No, he didn’t. The 2008/09 fiscal year reported a substantial deficit.
“You have no evidence for that.”
Actually Gosman has produced ample material on the ‘decade of deficits’ forecast at the end of Cullen’s tenure. Do you think the country just made that expression up Frank?
This article from October 2008 makes alarming reading http://www.nzherald.co.nz/business/news/article.cfm?c_id=3&objectid=10536181:
“It probably will. The Treasury finalised economic forecasts underpinning yesterday’s pre-election opening of the books in late August, before the latest bout of extreme financial market turmoil that has forecasters now predicting a global recession.”
“The domestic picture is as grim as the external one. No net increase in jobs over the next two years.
Stronger growth in wages will be almost swallowed up by higher inflation and, with households focused on reducing debt, little will be left for firms chasing the consumer dollar. Private consumption growth is expected to be zero in the year to next March and feeble the two following years.”
“Even without any election-related spending, the latest accounts look like they mark a historic turning point.
After 14 years of surpluses, we now face nine years of deficits.
“After a sustained reduction in public debt – under Governments of both stripes – it is now set to rise relentlessly over the next 10 years, well before the worst of the fiscal pressure from retiring baby-boomers hits.”
“Unfortunately our external accounts – large trade and current account deficits and net international liabilities of nearly 90 per cent of GDP – are really bad by international standards.
We are up to our nostrils in debt to the rest of the world at a time when creditors globally have become a lot less indulgent. And now the Crown accounts have turned red too.”
That’s the mess National have had to tidy up Frank. It’s a mess you simply cannot hide.
Except for one thing, Anonymous ACT Supporter Intrinsicvalue – you’ve mis-represented Brian Fallow’s opinion piece.
As Fallow wrote, “The Treasury finalised economic forecasts underpinning yesterday’s pre-election opening of the books in late August, before the latest bout of extreme financial market turmoil that has forecasters now predicting a global recession.”
Not the first time you’ve engaged in this kind of dishonesty.
National’s economic mis-management since 2008 has worsened matters considerably. Chief amongst those are two unaffordable tax cuts that deepened our debt.
As for Gosman – *pffft*! Neither of you are to be trusted. Your record for mis-leading statements is well know,
“Not the first time you’ve engaged in this kind of dishonesty.”
What dishonesty? I said things were a mess. Fallow agreed. Labour stuffed up.
By the way, the “mess” Labour left National was,
Labour succeeded in;
* paying down NZ’s sovereign debt to near zero,
* Cullen posting nine consecutive surpluses,
* unemployment at historical lows,
* plus a tax cut in 2008 (which I did not support, by the way)
* and average growth at 3.5%
Yes, we are “up to our nostrils in debt, Anonymous ACT Supporter Intrinsicvalue – that debt is $60 billion run up by National Finance Minister, Bill English.
Quite a change from the $8 billion that Cullen left at the end of his tenure in 2008, as John Key pointed out;
http://www.national.org.nz/mixed-ownership.aspx
http://webcache.googleusercontent.com/search?q=cache:nLphWzbp25wJ:www.national.org.nz/facebook_mixedownership/new/+&cd=1&hl=en&ct=clnk&gl=nz
Enjoy.
And so I ask again…as an alternative to increasing public debt during the recession, would you have cut welfare or delayed the Christchurch rebuild?
Which is it Frank?
And you might want to run this graph Frank…http://www.tradingeconomics.com/new-zealand/government-debt-to-gdp.
You’ll see that as a % of GDP, NZ’s debt is not high by historic standards, and is on the way down.
So which would you have cut, Frank. Rebuilding Christchurch, or welfare?
That claim about “ten years of predicted deficits” was made by Key in one of his blame-gaming tricks. It was never made by any reputable organisation, so you are basically parroting National Party rhetoric and lies.
As per usual.
Frank this is not the first time you have posted material that simply does not support your associated commentary.
Figure 1
Your graph shows the OBEGAL dropping dramatically in the last years of the Labour Govt, finally delivering a deficit in their last year in power (2009). On the other hand, apart from 2011, the OBEGAL steadily improves under National.
Figure 2.
Your graph shows a sharp decline in Crown revenues from 2006 (as I have previously pointed out is before the GFC), and a steady improvement once National arrested this from 2010/11.
Figure 3.
Crown debt has risen sharply under National due to their decision to rebuild Christchurch, and to buffer the economy from the GFC. Are you arguing the Govt. should not have done these things?
Figure 4.
The figures are apples and oranges. Where did you get your apples?
Figure 5.
Your graph depicts a catastrophic situation later in the Labour Govt’s tenure; rapidly rising interest rates at a time of an impending local recession. It also depicts national running a lower interest rate regime.
Anonymous ACT Supporter Intrinsicvalue – never mind your mis-leading garbage. You’ve utterly missed the point of my post, haven’t you?
Read the bloody thing first, you simpleton.
I did read it. The point of your post is to continue your efforts to overturn the prevailing view that Labour can’t manage the economy competently. Your own data demonstrates that National have managed the economy far better than Labour did, and this isn’t the first time you’ve been caught out like this.
The only one “caught out” is you. As in you haven’t bothered to read what I’ve written, as evidenced by your failing to address the points I raised: that Bill English has not been consistent with the data he presented in his Budget document.
This is born out by examples I’ve presented (and which you haven’t refuted) and data freely available from Treasury and other sources – including Bill English’s 2013 Budget!
As an Anonymous ACT supporter, Intrinsicvalue, you do your right wing cause more harm than good with your continued penchant for twisting things and sheer dishonesty.
Have a good day.
He may not have been consistent in the presentation, but if all you have is to argue moot points about statistical presentation, you’re rapidly running out of credibility.
“Running out of credibility”?!?!
LMAO!!! 😀
Sez the anonymous troll hiding behind a pseudonym!!
😀
If you won’t stand behind your assertions, why should any of us? Your anonymity shows how much faith you put into your own beliefs! 😀
Thanks for the laugh! 😀
Annual CPI
Sep 2008 = 5.1%
Mar 2014 = 1.5%
Current Account Deficit (% of GDP)
Sep 2008 = 8.9%
Dec 2013 = 4.1%
OCR
Sep 2008 = 7.5%
Apr 2014 = 3.0%
GDP – Annual Growth
Sep 2008 = -1.7%
Mar 2014 = +3.1%
Sources:
http://www.treasury.govt.nz/economy/overview/2010/04.htm
http://www.rbnz.govt.nz/monetary_policy/ocr/
http://www.stats.govt.nz/browse_for_stats/economic_indicators/CPI_inflation/ConsumersPriceIndex_HOTPMar14qtr.aspx
http://www.interest.co.nz/bonds/67863/nz-annual-current-account-deficit-41-gdp-september-quarter-revised-39-june-quarter
http://www.tradingeconomics.com/new-zealand/gdp-growth-annual
Labour Force Participation Rate
Dec 2008 = 68.2%
Mar 2014 = 69.3%
(A record high)
http://www.tradingeconomics.com/new-zealand/labor-force-participation-rate
Who are you trying to impress/convince with your half-truths this time?!
For example,
You haven’t mentioned the unemployment rate: still stuck on 6% for the last two Quarters.
And under-employment is rising.
Your “facts” are worthless because they are cherry-picked and misleading.
Oh I did mention employment Frank. Labour force participation rate…highest on record under National.
Now you’re just being pathetic.
[…] it isn’t 100% of Labour Party voters didn’t support the Budget. TDB has provided many analysis of the Budget showing it up for the sad joke it […]
Comments are closed.