
.
![]()
.
Continued from: 2015 – Ongoing jobless tally
So by the numbers, for this year;
.
Events
.
January
- Gameloft: 150 redundancies
- ROA Mine: 20 redundancies
- NZ Bus: 200 redundancies (t.b.c)
February
- Fairfax media: 70 redundancies
- Prime Range Meats: 130 redundancies
- Stonewood Homes: 85 redundancies
- Dick Smith Electronics: 430 redundancies
March
- Wellington Hospital: 40 redundancies
- Solid Energy: 41 redundancies
- Bathurst Mining: 25 redundancies
- NZ Post: 500 redundancies
April
- Ministry of Justice: 100 redundancies
- Fisher & Paykel: 180 redundancies
- Cavalier Carpets: 65 redundancies
.
Statistics
.
.
.
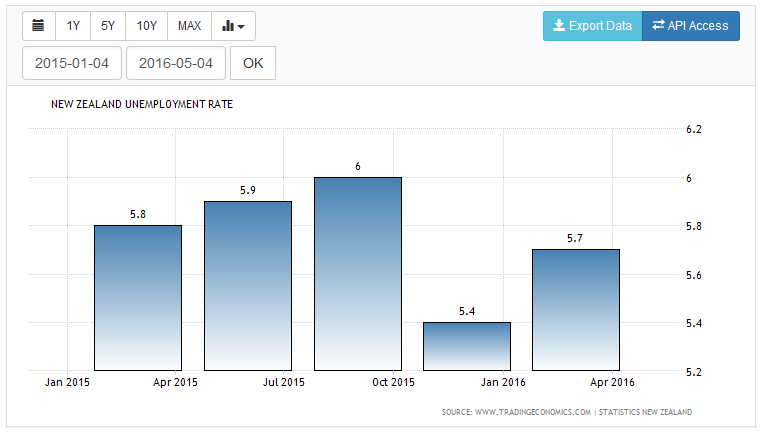
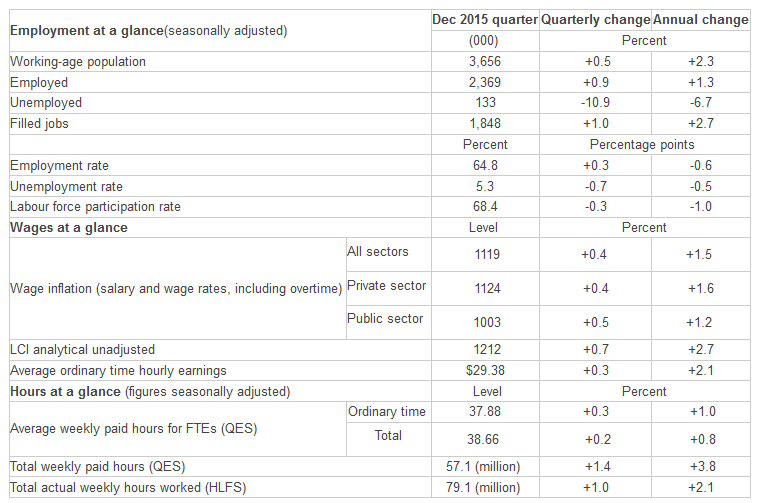
December 2015 quarter – Employment & Unemployment
.
.
Labour market at a glance
- Unemployment rate falls to 5.3 percent.
- Labour force participation rate falls for third consecutive quarter.
- Employment growth rises to 0.9 percent for the quarter.
- Annual wage inflation lowest since March 2010.
Additional analysis;
However, there was also a fall in the number of people looking for work, which also contributed to the lower jobless rate.
The jobless rate fell to its lowest level since 2009, with strong growth in the construction, retail and hospitality sectors.
Job growth was strong in the Auckland region as well as Wellington and Manawatu.
But the data also showed 14,000 people had stopped looking for work for various reasons, even though the size of the workforce had increased, driven by record immigration.
This led to a fall in the participation rate – the number either in work or looking for work – which Statistics New Zealand said also reflected people who had left the labour force, such as the retired.
But an economist said the fall in participation did not tally with growth in jobs and raised doubts about the reliability of the jobs data.
“The HLFS (household labour force survey) has long had questions over its accuracy given that there have often been cases where large ‘surprises’ such as today’s outcome are thrown up. Those questions will linger today,” ANZ senior economist Philip Borkin said.
.
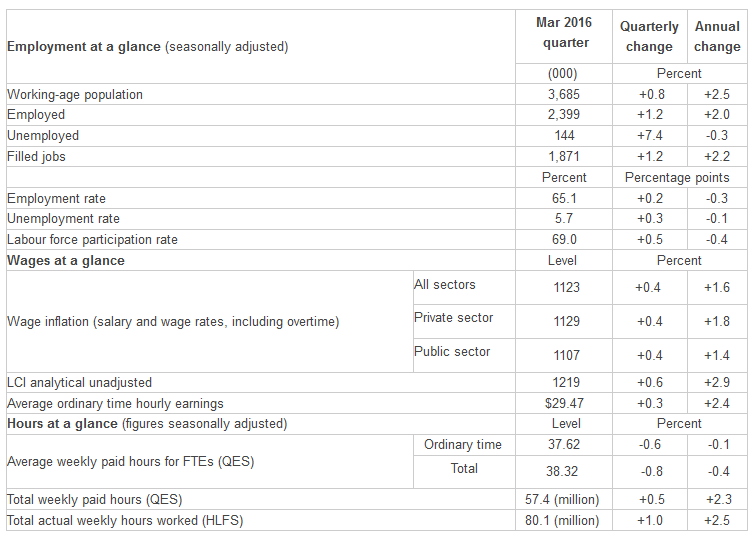
March 2016 quarter – Employment & Unemployment
.
.
Labour market at a glance
- New Zealand’s labour force grows 1.5 percent, the largest quarterly growth since December 2004.
- Employment growth exceeds population growth over the quarter.
- The unemployment rate increased to 5.7 percent, from a revised rate of 5.4 percent last quarter.
- Wage inflation remains subdued.
.
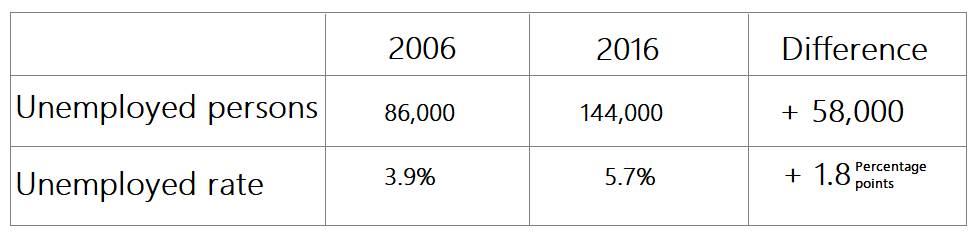
Unemployment – Decadal Comparison
.
.
.
.
.
Addendum1: Under-employment
The under-employment stats;
People who are underemployed are those who work part-time, would prefer to work more hours, and are available to do so. In unadjusted terms, the number of underemployed grew by 12 percent over the year. While the number of part-time workers increased over the year, the ratio of people underemployed to employed part-time also rose – from 17.1 percent in June 2013 to 18.7 percent this quarter.
Official under-employment: up
Definitions
Jobless: people who are either officially unemployed, available but not seeking work, or actively seeking but not available for work. The ‘available but not seeking work’ category is made up of the ‘seeking through newspaper only’, ‘discouraged’, and ‘other’ categories.
Under-employment: employed people who work part time (ie usually work less than 30 hours in all jobs) and are willing and available to work more hours than they usually do.
Employed: people in the working-age population who, during the reference week, did one of the following:
-
worked for one hour or more for pay or profit in the context of an employee/employer relationship or self-employment
-
worked without pay for one hour or more in work which contributed directly to the operation of a farm, business, or professional practice owned or operated by a relative
-
had a job but were not at work due to: own illness or injury, personal or family responsibilities, bad weather or mechanical breakdown, direct involvement in an industrial dispute, or leave or holiday.
Addendum2: Other Sources
Statistics NZ: Household Labour Force Survey
Addendum3: Definitions
“Labour force participation rate” – the total labour force expressed as a percentage of the working-age population. Labour force participation is closely linked to how the working-age population is defined.
.
.
To be periodically up-dated.
.
.
= fs =


Impeccable work as usual Frank and it shows that the slogan “National for a brighter future” is just an urban myth which lies on the scrap heap as they sold all our assets for nothing!!!!!
Tantamount to treason, so they should like Weldon also walk the plank.
See now the regional rail closure policy Government is pursuing is also creating problems that all regions will have including our Napier Gisborne regions.
http://www.radionz.co.nz/national/programmes/morningreport/audio/201799532/residents-want-action-on-logging-truck-accidents
Residents want action on logging truck accidents
They want rail to take the logs.
Residents of a winding Whangarei road where log trucks keep crashing are worried there will soon be a fatality.
· Listen (duration 4′ :18″)
· Download: Ogg | MP3
No surprise. The dairy sector is down the drain; the oil sector is down the drain; meat is not doing particularly well; forestry is not doing particularly well; communities are being crushed by city and district councils squandering money ‘like it’s going out of fashion’.
Only immigration-induced construction of houses, shopping malls and roads, funded by out-of-control debt, provides a thin façade of success via massive mal-investment.
http://www.nationaldebtclocks.org/debtclock/newzealand
Welcome to ‘the new normal’.
sounds like the gnats are manipulating the stats
The farce has long been in how being employed is defined and how the unemployed are counted.
Real unemployment could easily be an order of magnitude higher than official figures.
And do not forget the criteria to be “employed” is that working just one hour per week means that a person is not unemployed.
The 6 point something, now near 7 percent rate, is misleading, as it does include such “work” that is marginal, part time, casual and also excludes the ones who have long given up to look for work, as they cannot find decent work.
And this government does also allow in high numbers of overseas students, who can legally work up to 20 hours per work, but in many cases work longer, as I have heard repeatedly from some of them, as it is so easy to cheat under the present system.
Then the continued net immigration gain also brings in many desperate, who work for almost any conditions, often under the minimum wage.
We have only got “growth” due to the spending of those with high value housing equity as a result of the property price bubble, and due to increased construction and tourism, little else.
This makes for a very vulnerable economy, as any of these conditions can change quickly and lead to a bust scenario.
Debt is still rather high, and so many will be hit when things slow down. But the government does avoid this to happen, to simply increase demand by growing the population and visitor numbers, allowing in many new immigrants.
One day Kiwis will curse themselves, as they will see that the grown population will stress our limited resources and put a great strain on government and other services. It is simply not sustainable, and so far only enabled through continued fossil fuel use.
Interesting information, Frank. Thanks for the regular up-dates!
Comments are closed.