
.

.
A very insightful piece by Dr Deborah Russell, lecturer in taxation at Massey University, and Labour candidate for Rangitikei, raised a clear picture of the difference between equality and inequality;
.

.
There is little doubt that inequality has increased over the last thirty years. In February this year, a bungle by Treasury resulted in child poverty numbers being underestimated by twenty thousand. Income inequality was also underestimated.
Part of the reason has been one aspect of the neo-liberal “revolution”: tax cuts and increased user pays.
New Zealanders could do well to reflect that, since 1986, we have had no less than seven tax cuts;
1 October 1986 – Labour
1 October 1988 – Labour
1 July 1996 – National
1 July 1998 – National
1 October 2008 – Labour
1 April 2009 – National
1 October 2010 – National
At the same time we have had less revenue from SOEs as they were privatised or partially-sold off.
So it’s little wonder that more and more User Pays has crept into our economy/society, such as $357 million in “voluntary” donations for ‘free’ schooling, that parents have to cough up each year. That’s on top of school uniforms, text books, shoes, personal equipment, etc.
The neo-liberal revolution of the 1980s and 1990s didn’t stop, it just became more covert, with incremental increases, so we barely noticed. And when we did notice – such as the increase of prescriptions from $3 to $5 – public opposition was muted. Yet, once upon a time, prescriptions cost 50 cents each, and before that, were free.
An indicator of growing inequality is the level of home ownership in this country. This is a core statistic that cannot be fudged by National’s spin-doctors and their right-wing, One Percenter wannabes/sycophants.
According to the 1986 Census, home ownerships rates in New Zealand was 74.1%, with 23.1% renting.
By 2013, according to last year’s census, the figures had changed radically;
» 49.9% owned their own home (54.5% in 2006)
» 14.8% homes were owned by a Trust (12.3% in 2006)
» A total of 64.8% of households owned their home or held it in a family trust (66.9% in 2006)
» 35.2% were renting/did not own their own home (33.1% in 2006)
As the Census 2006 Housing in New Zealand report stated,
“Over the 2001 to 2006 period the incomes of the majority of private-renter households have for the first time since 1986 increased more quickly than owner-occupier households. This supports the contention that an increasing number of working households on what would previously be considered ‘reasonable’ incomes can no longer access home ownership.
The decline in home ownership rates over the 1991 to 2001 period was significantly greater for younger households than it was for older households. This trend would appear to have continued over the 2001 to 2006 period. The gap between the home ownership rates of couple-with-children households, who have historically had the highest home ownership rates, and other types of households, narrowed over the 1991 and 2001 period, and has continued to narrow over the 2001 to 2006 period. Conversely, the home ownership rate gap between couple-only households and other types of households has widened over both periods, in favour of couple-only households. Home ownership rates as would be expected increase with household income. There are, however, differences between regions, based we suspect, on differences in average house prices by region.”
The upshot is that whilst home ownership rates are in free-fall – unsurprisingly renting is steadily increasing.
National’s response to address our critical housing? To reduce demand – not by building more houses – but by restricting first home owners with a 20% Loan To Value Ratio (LVR). This measure forced a sizeable chunk of house-buyers from the market, whilst local and offshore speculators were allowed free reign.
This is most definitely not what was promised to this nation in the late 1980s, when “trickle down” was supposed to increase our wealth. To the contrary, as the decades slide by, it is more and more apparent that we’ve been cruelly hoaxed.
I am reminded of something John Key said in a speech, when he scathingly condemned the previous Labour government in an election speech on 29 January 2008;
.

- “Well, I’ve got a challenge for the Prime Minister. Before she asks for another three years, why doesn’t she answer the questions Kiwis are really asking, like: […] Why can’t our hardworking kids afford to buy their own house?”
.
Good question, Dear Leader. Good question.
.
*
.
Postscript – A tale of denial
.
#1 – Crisis

#2 – Denial
.
#3 – Blame others

.
#4 – Revelation

.
#5 – Toughlove

.
# 6 – Acceptance?
.
References
NZ Herald: Deborah Russell: We all deserve to get a fair go
Radio NZ: Govt disappointed by stats bungle
Fairfax media: Children in poverty vastly underestimated
NZ Herald: Parents fundraise $357m for ‘free’ schooling
NZ 1987-88 Official Yearbook: Table 6.4. TENURE OF DWELLINGS (6.1 Households and dwellings)
Statistics NZ: 2013 Census QuickStats about national highlights – Home ownership continues to fall
Statistics NZ: 2006 Census – Dwelling ownership
Centre for Housing Research: Census 2006 Housing in New Zealand
John Key.co.nz: A Fresh Start for New Zealand
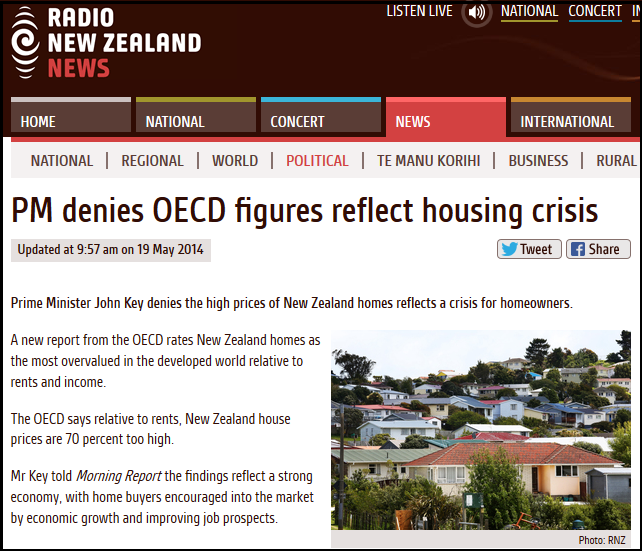
Radio NZ: NZ housing market most overpriced – report
Radio NZ: PM denies OECD figures reflect housing crisis
NZ Herald: Housing crisis worse under Clark’s Government – Key
TV3: Key ‘out of touch’ over housing crisis
Scoop media: You’re wrong John, there is a housing crisis in NZ
Additional
Fairfax media: Housing affordability getting worse
Closer Together-Whakatata Mai: New Zealand’s income inequality problem
.

.
.
= fs =


Well researched as always Frank.
Thanks, Alex.
More to come on these issues soon…
Good article with lots of great information.
Does Key really think that just because ‘he’ says there’s no problem, there aren’t any homeless, or over crowded, or poor families in NZ?
He must be on very good drugs.
I wonder if ‘he’ thinks he’s one of the ‘hard-working kiwis’. Funny huh!
opinion.
Thanks, Mistery. The mnore that Key denies the problem exists, the deeper the hole he is digging. (And not a hole for a pile for a new house, I should add.)
The thing that worries me is that, like the food-in-schools problem, National will come up with a half-arsed, watered-down “solution” that does nothing to resolve our housing crisis but succeeds in taking it away from the media focus.
Thanks for the discussion of my article, Frank, and for linking it so effectively to housing issues.
You’re welcome, Deborah. The indicators thus far is that neo-liberal “reforms” since 1984 have not benefitted New Zealand society as much as had been promised.
And when National Minister Nick Smith states that a housing solution is 20 years away (translation: never), then it should be readily apparent to most intelligent people that National/ACT are clueless when it comes to this problem (I refuse to call it an “issue”).
http://www.nbr.co.nz/article/affordable-housing-20-years-away-housing-minister-nick-smith-ck-154701
Thanks for the article you wrote, Deborah. Well done!
The indicators thus far is that neo-liberal “reforms” since 1984 have not benefitted New Zealand society as much as had been promised.
Please tell me how they have benefitted New Zealand society at all! Except perhaps the very few at the top of the trough.
Remember also how National in 2008 campaigned on bringing the NZ economy up to par with Australia, including wage rates. They knew they couldn’t do it and that it was a blatant electioneering lie which was quietly dropped very soon after they took over. Least we forget!
Bill English’s new line is that our country is a great place for Australian business to set up because our wages are so low!
Great post Frank, full actual facts and figures – with well deserved praise from Deborah!
Key’s total disconnect was confirmed (again) last week when I saw him on TV testily lecturing a gaggle of reporters that there is “fundamentally no inequality” in NZ.
This seems to be the right-wing response to all social problems – denial. If a problem does not exist, nothing needs to be done about it. Problems solved!
Key is, apparently, going to be meeting Barack Obama again soon. It is a shame some of the Obama liberalism and real-world policies for the US don’t rub off on Key. That’s a pipe-dream I know but makes for another great photo-op in election year.
Key is too arrogant (?) to figure out what got Obama elected.
I was born disabled and as such am automatically in the poor bracket (employers don’t discriminate right…) I work part time for myself and my wife also works fulltime, I have never been in a position to save as most of my income always ends up either in the govts pocket through taxation or stealth tax (power, fuel ect) in the pocket of the landlord (yes I rent and have had to all my life) or paying for the likes of food, medication or basic necessities, I have never been on holiday anywhere.
It pisses me off that the govt tells us we have to start saving or they are about to introduce the likes of compulsory kiwisaver when they do absolutely nothing about all the things that are costing us a fortune that they could regulate but don’t or they do more about the increase in incomes.
It has come to the point where I don’t see the benefit of either Labour or National leading the country, neither seem to do anything right.
Frank there are some serious flaws in your analysis that cannot go unchallenged.
1. Your list of tax cuts conveniently omits the fact that tax increases that also applied during the period, and the fact that at least one of those rounds of cuts was part and parcel of a tax package that included an increase in GST. What is more misleading is your suggestion that tax cuts over that time have led to more inequality. Using the calculator at https://brc2.ird.govt.nz/web-determinations/investigate/Tax+on+Annual+Income+Calculator/en-GB/Attribute~Out_Global_InterviewCompleteTOAI~global~global/qs%24s2%40Interviews_ScreensFile2_xint%24global%24global?user=guest, I have calculated the respective tax changes for someone earning 45,000, 65,000 and 120,000 per annum. The % change in tax from 2006 to 2015 for all three income brackets is exactly the same, a reduction of 6%. Given other changes to the tax system over that time (e.g. the removal of depreciation claims from rental properties, the tightening of application of capital gain taxation, the fact that higher income earners pay more GST than lower income earners) it s clear that tax changes have absolutely NOT contributed to increasing inequality.
2. Your comment “An indicator of growing inequality is the level of home ownership in this country” is unsubstantiated. Homeownership is a function of many variables, a significant one being immigration. Asian and subcontinent immigration in particular has changed home ownership patterns in NZ, as these folk come from cultures where home ownership is not as prevalent as in NZ. By your own figures (“A total of 64.8% of households owned their home or held it in a family trust (66.9% in 2006)”) the change in home ownership is barely significant.
3. You claim a housing affordability crisis that is simply not born out by the facts. The ROOST index shows housing in NZ is more affordable than in was 6 years ago, and with employment rising and interest rates remaining well below the historic levels of 2008, this will likely continue to improve.
@IV:
More deluded waffle!
re 1: Why didn’t you start – in your calculations – with the $19k-$30k, and the $30k-45k income groups. These groups are a very real part of our society.
Obviously you are on Keys gravy train – coz you are pretending this wage bracket does not exist! But they do, they really do. Wake up!!
re 2: It is not for the asians to control our housing market, it is OUR right to control OUR own housing market – they should be second fiddle, not us! They should have our scraps, not the other way around as is currently the real state of this matter!
re 3: No rental properties are affordable to people who rent. And according to the OECD we are 70% over-priced here in NZ. So how about you as a capitalist landlord, reduce all the rents on all your rental properties by this 70%, and bring yourself economically in line with the OECD.
This would show that you truly care about Kiwis trying to eke out a living in NZ.
Oh but wait – the govt and all its’ cronies and flunkies – like you IV – like to pretend we don’t have abused poor people in NZ.
What a huge pile of garbage you spout above there!
Opinion and belief.
1. Someone earning $30,000 per annum paid $5,850 in tax in 2006. In 2015 they pay $4,270. That is a reduction of 27% or $30 per week, considerably more than the 6% reduction on the higher incomes, and considerably more than a 2.5% increase in GST.
2. Asians don’t control our housing market, kiwi’s do.
3. Overpriced compared to what? Prices will drop when supply exceeds demand, which will happen when Auckland’s council get’s off it’s backside and frees up more land.
re: Intrinsicvalue @ May 21, 2014 at 8:33 pm.
Nothing you have written counters the information I have presented. The fact you have not presented citations for your assertions suggests they are lacking in credibility and will not withstand scrutiny.
Therefore, I stand by my facts and analysis.
” a tax package that included an increase in GST”
wasnt GST increased well after the tax cuts? – ie: they werent the same package
unless of course your admitting the nats kept the GST increase secret
http://taxpolicy.ird.govt.nz/news/2010-05-20-budget-2010-tax-announcements
The 2010 tax policy included an increase in GST and personal tax reductions.
GST is forever.
Fuel taxes are forever.
Rates increases – (plus GST) show no sign of ending, do they?
Tax cuts – rapidly recovered by the application of the above increases, and several more.
Give with one hand and take heaps more with the other.
And I, too, would love to see your sleight of hand with the income bands that cover so many people. Those who slog for pay below the magic $45k.
Suggest you reread Mark@7.41pm – that’s a common reality. The tax cuts’ pathetic five bucks ‘in the hand’ that came for low income people goes absolutely nowhere – and you know it.
The mendacious wee man said, acshully, no one would be worse off. Yeah, right.
And Andrea Mark’s post specifically referred to Govt. introducing compulsory KiwiSaver. That is a punitive brain fart of the Labour Party, not this Govt.
Oh give it a rest intrinsic. I may not be a trained economist but even I can recognise your bullshit. Your not convincing anyone, LOL!
But Intrinsic, National supports Kiwisaver and is going to make it compulsory!
No, it’s Labour who are advocating compulsory KiwiSaver. Look it up.
Sorry Andrea, you are letting your emotions get in the way of the facts.
Using the calculator at https://brc2.ird.govt.nz/web-determinations/investigate/Tax+on+Annual+Income+Calculator/en-GB/Attribute~Out_Global_InterviewCompleteTOAI~global~global/qs%24s2%40Interviews_ScreensFile2_xint%24global%24global?user=guest:
Someone earning $30,000 per annum paid $5,850 in tax in 2006. In 2015 they pay $4,270. That is a reduction of 27% or $30 per week, considerably more than the 6% reduction on the higher incomes, and considerably more than a 2.5% increase in GST.
@IV:
Dollar-wise, your sums and %s dont add up at all. 6% to a top income earner (who is probably playing the tax avoidance game anyway) is far more than $30! Did you put the rent on your rental properties up by $30 when you found this out?
And you still forgot about the really poor income bracket – the $19k-$30k group of NZ citizens.
Opinion.
You forget Working for Families, and other targeted low income supplements. The lower income earners simply don’t pay enough tax to apply a flat value reduction, unless we move to a tax free threshold…which I favour. Unfortunately Labour chose to bribe the country with WFF, which takes money from taxpayers, and then returns the same money, less costs of bureacracy, to many of those same taxpayers. WFF has trapped people in welfare dependency that should never qualify for state assistance, and it is to National’s eternal shame they have not revoked this horrendous imposition.
For the record, I have run the sums on annual incomes of $20,000, $40,000 and $60,000. The % reduction in tax between 2006 and 2015 are (respectively) 35%, 25%, 25%. The lower the income, the higher the % reduction.
As an aside, I would point out that the minimum adult wage is actually $30,160. In 2006, their net income would have been $24,279. If they spent their entire nett income, the extra GST they would pay from 12.5% to 15% would be $607 per annum. Their nett pay, after the 2010 tax cuts, increased by $1,583 per annum, well over double the amount required to cover the GST increase.
The lie spread by the left about the tax cuts under this Govt. is just that, a lie. Proportionately the less well of have benefitted far more from tax cuts than those on higher incomes, and the figures I have presented prove this conclusively.
You have proved nothing.
Without citations, your anti-Labour rant is not credible.
You have been shown to be a liar in the past.
@IV:
Forgot to mention:
The people who qualify for WINZ income, lets just use the unemployment statistics at 175,000 people with no jobs (because there aren’t 175000 job vacancies).
If you take those 175000 people and multiply their $150 a week income by 52 weeks you get $7,800.
Now if you multiply their annual income $7,800 by 175,000 you get $13,650,000.
Now you really need to ask yourself what all the WINZ money is truly spent on.
It is spent on WINZ staff wages, consultants, bureaucracy, conferences, stationery, and any other whimsical idea that WINZ and the govt can think of. As long as it doesnt go towards creating jobs, homes and comfort for all these jobless victims, the govt seem to be happy about this very sick state of affairs.
What is all the missing money really being spent on, and then being improperly allocated as an expense against WINZ.
There is some exceptionally ‘wicked’ accounting going on within this govt, and it is about time there was transparency about what our tax money is really used for.
Opinion.
@IV:
So according to you, (uncited) these people on the minimum wage (and now I would like to add the people who get WINZ benefits – be it for disabilities or no jobs out there etc), get in their hand $24,279. (WINZ approx $15,000).
Now lets take their annual rent off this figure (average $350 weekly) $18,200 and those workers on the minimum wage are left with $6079. Those people with disabilities etc entitling them to WINZ benefits do not even have enough to pay the rent, and are in fact short of $3,200. They haven’t even fed their children, paid for water, electricity, communications, registered their cars or bought bus and train tickets, or clothes.
Do you see why your head is always in the wrong place IV? I do.
Opinion.
People on the minimum wage can’t afford to rent or have children, and therefore shouldn’t be. End of story.
I’m not responsible for someone else’s income level, although I do support National’s move to lower their tax burden, something Labour opposed.
For the record, I favour a high tax free threshold, accompanies by a removal of WFF for middle income earners. That would truly target the low income earners you speak of, and remove the welfare trap Cullen and Clark out thousands of middle class NZ’ers into.
Frank – thanks for presenting the info in easy to understand ways.
Seven tax cuts since 1986!!! No wonder early childhood education , social housing, and rape counselling organisations are always underfunded!!Didn’t I read somewhere that Paula Bennett and John Key got FREE taxpayer funded university educations???
I am soooooo voting Green Party this year!!!
No. I am the same age as Key my tertiary education was most certainly not ‘free’.. There is no such thing as ‘free’ education. Never has been, never will be.
Another of your lies.
Key obtained his free tertiary education prior to 1992, when student fees were raised and student loans were introduced.
Prior to 1992, fees were minimal, and more than made up by student allowances.
Don’t you think it should be? Is it not wiser for the older generation to “front” you the cost of your education so you can pay it back later as taxes that pay it forward to your children?
Comments are closed.